


#Design
#Repo Pages
How we built our Lottery Factor chart
Isa Bensusan
4 mins read

If you’ve been in open source long enough, you’ve most likely seen xkcd’s meme about how all of the internet’s infrastructure depends on a project some random person has been maintaining for years. You know the one.
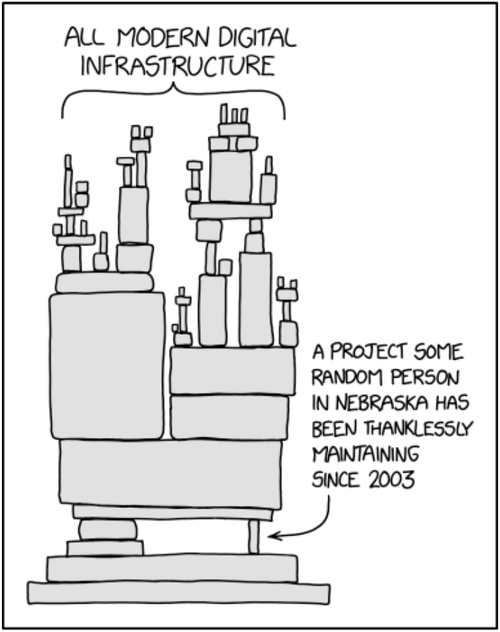
But the issue is: it’s just as hilarious as it is scary, because what happens when the random person in Nebraska is gone? Take core-js’s story as an example: a JavaScript library with 9B downloads and a maintainer that went through one-too-many struggles with no support from the community (including jail!). When he eventually decided that he wouldn’t work on the project anymore the repository was left to die slowly, leaving billions of users to fend for themselves.
This same story could be repeated with any of the hundreds of projects in your software supply chain, but there is no way to know until it’s too late… or at least that’s what we kept hearing from our users and members of the open source community.
We even got specific feedback from engineering managers on our network that have had teams make "poor dependencies choices" for packages that are ill maintained or completely abandoned,
And so, with this pain point in mind we set out to build a solution.
The problem
If a project has a strong contributor base and the knowledge is distributed among different people, then one person leaving won’t pose a serious threat to its sustainability. But if a project’s livelihood depends on only one or two people, this makes it very risky to consume it.
The problem is that there is no easy way of identifying how much a project depends on its maintainers or top contributors.
Of course, we knew Bus Factor was already a thing (which answers the awful question of “what is the number of contributors that, if run over by a bus, would mean the end of this project?”), but there was no straightforward way to calculate it. The contribution data was hard to obtain without writing custom code and hitting the Github API, and doing a manual calculation meant getting deep into a repository’s PRs list.
Plus the whole concept of a maintainer being run over by a bus just didn’t sit well with us.
Our solution: the Lottery Factor
After conducting research on the topic and speaking to many maintainers and developers, we decided to take over the concept of Bus Factor and revamp it. Instead of being a niche, hard to get metric, we wanted to make it accessible, approachable and easy to find.
We started by renaming it to “Lottery Factor”, so instead of being run over by a bus, a maintainer’s decision to leave would be made by winning the lottery – and our maintainer friends seemed to like it much better.
Our goal
We wanted to keep the basis of the metric the same (the smallest number of people that make 50% of contributions) but we knew just a number wasn’t enough context for a user to really understand the concept at a glance.
The goal when designing the chart was to allow users to:
- Be able to easily identify a project’s Lottery Factor
- Quickly understand how risky a project’s Lottery Factor is
- Identify contributors that make up the Lottery Factor
- Visualize how work is distributed among these contributors
- Find information and guidance on the topic
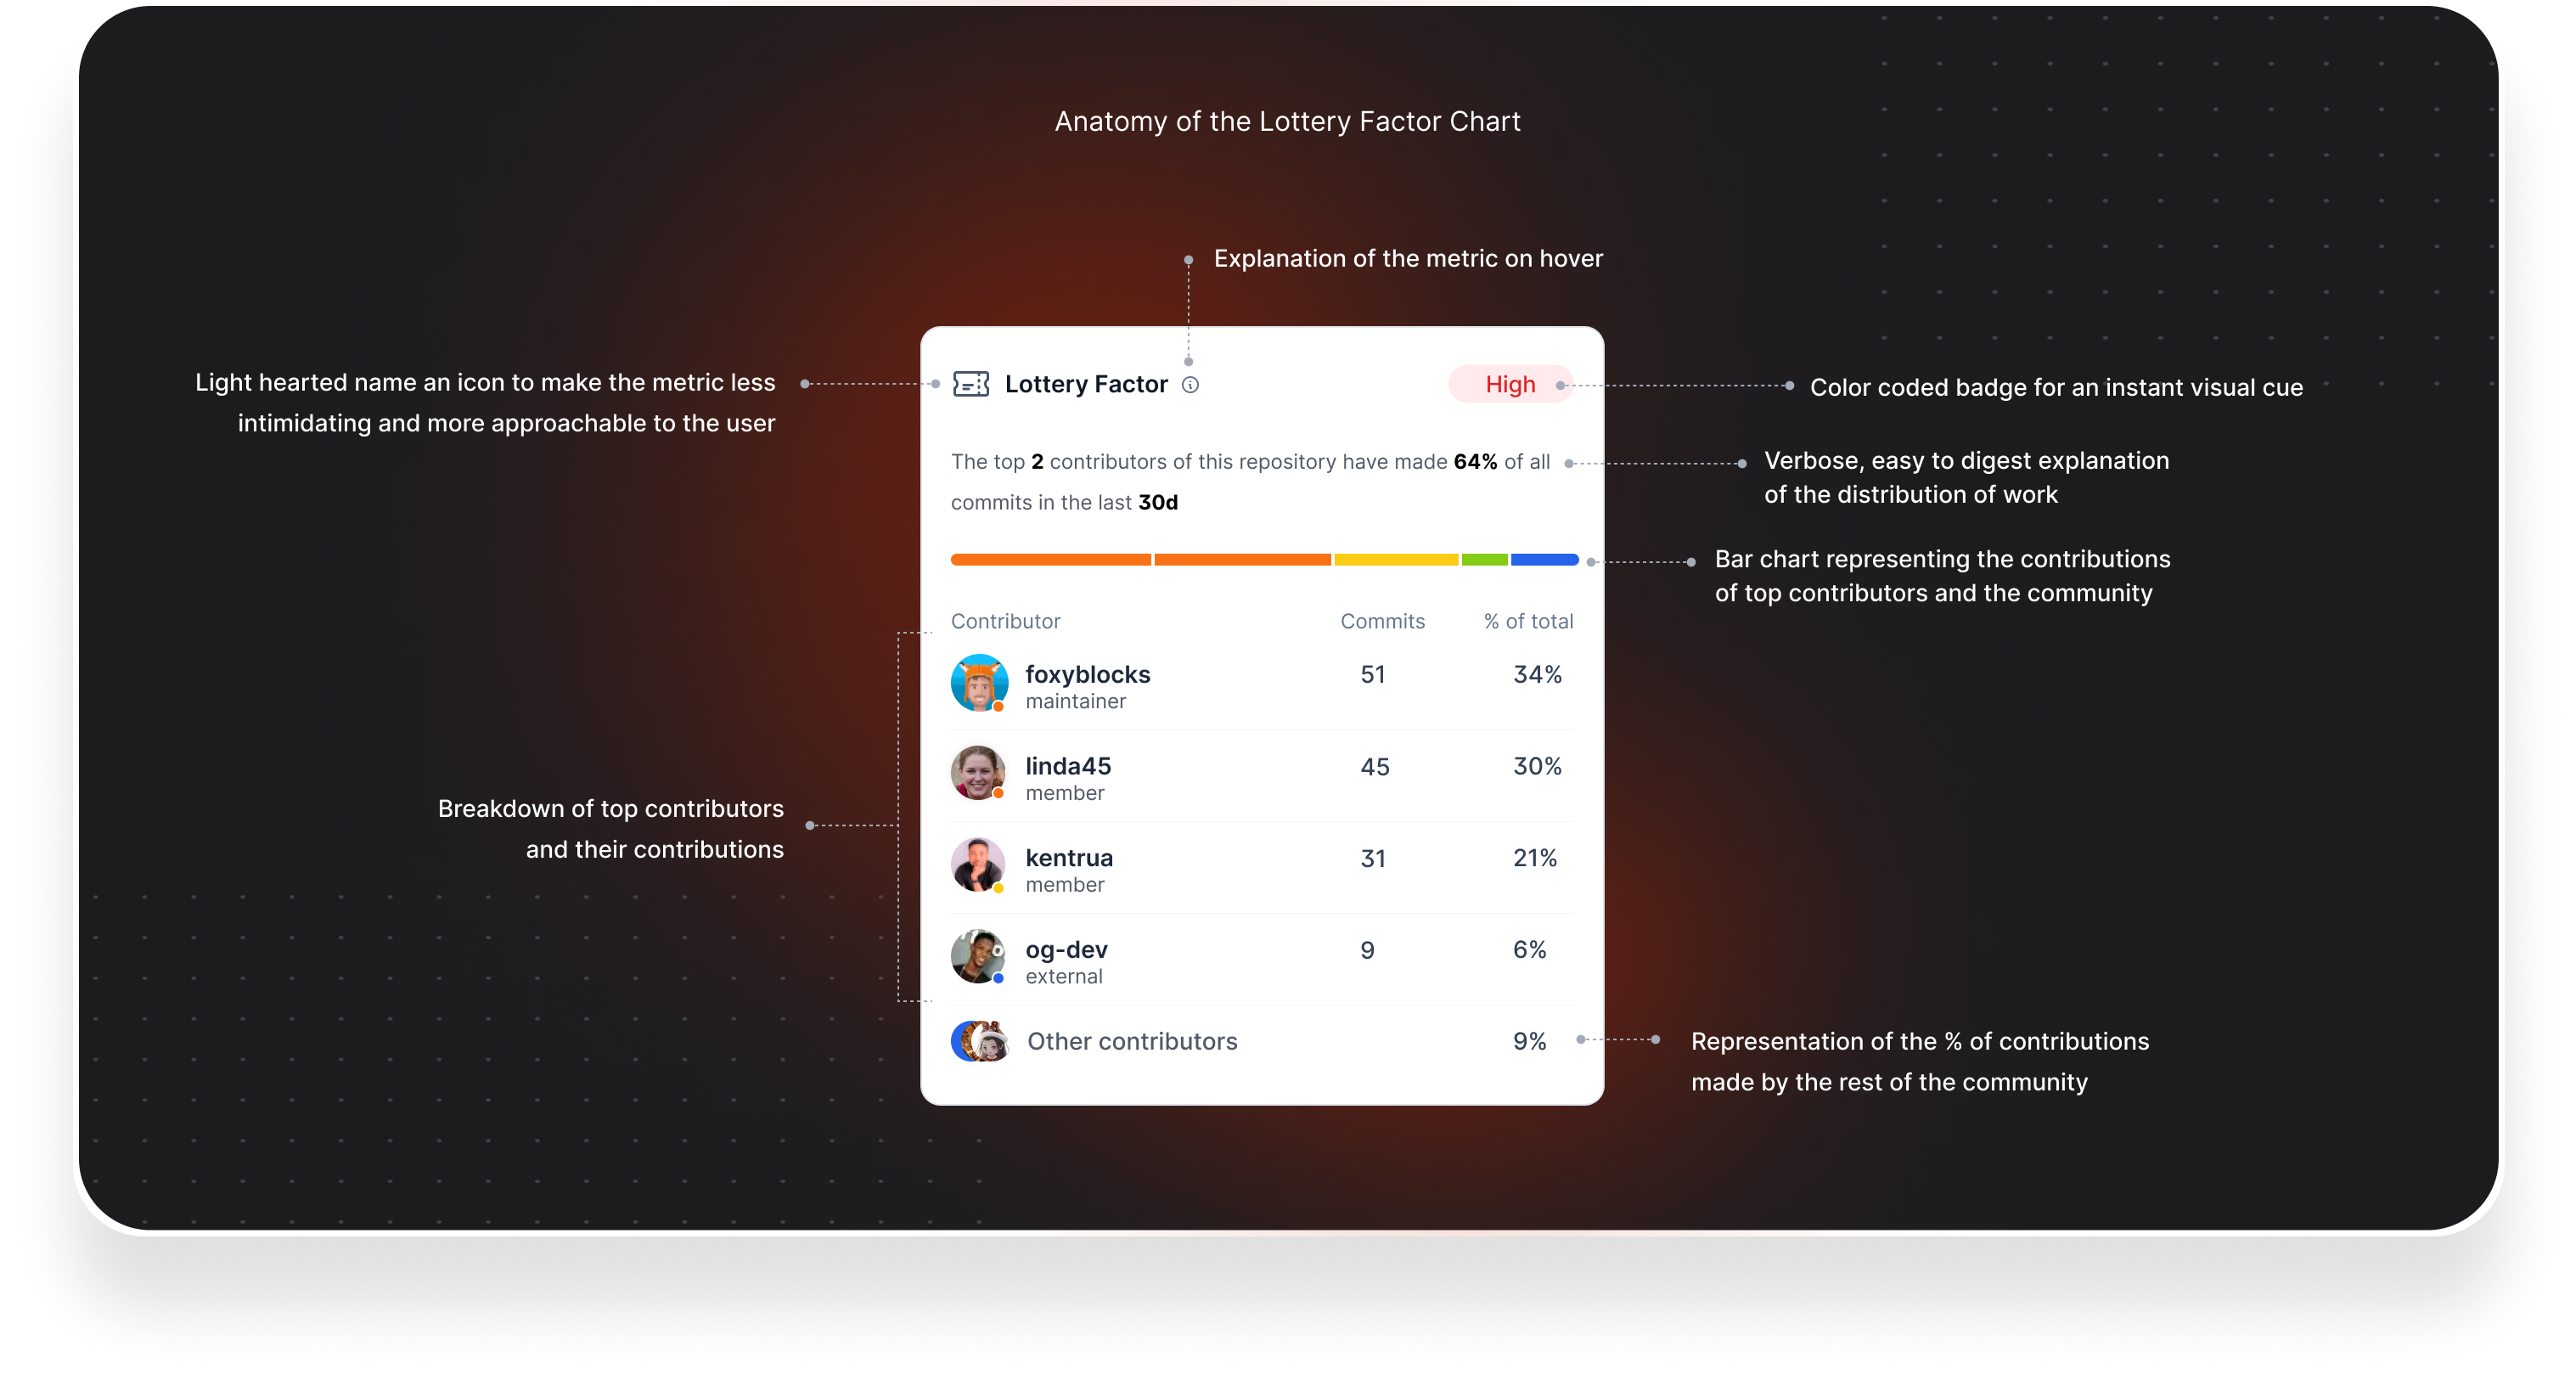
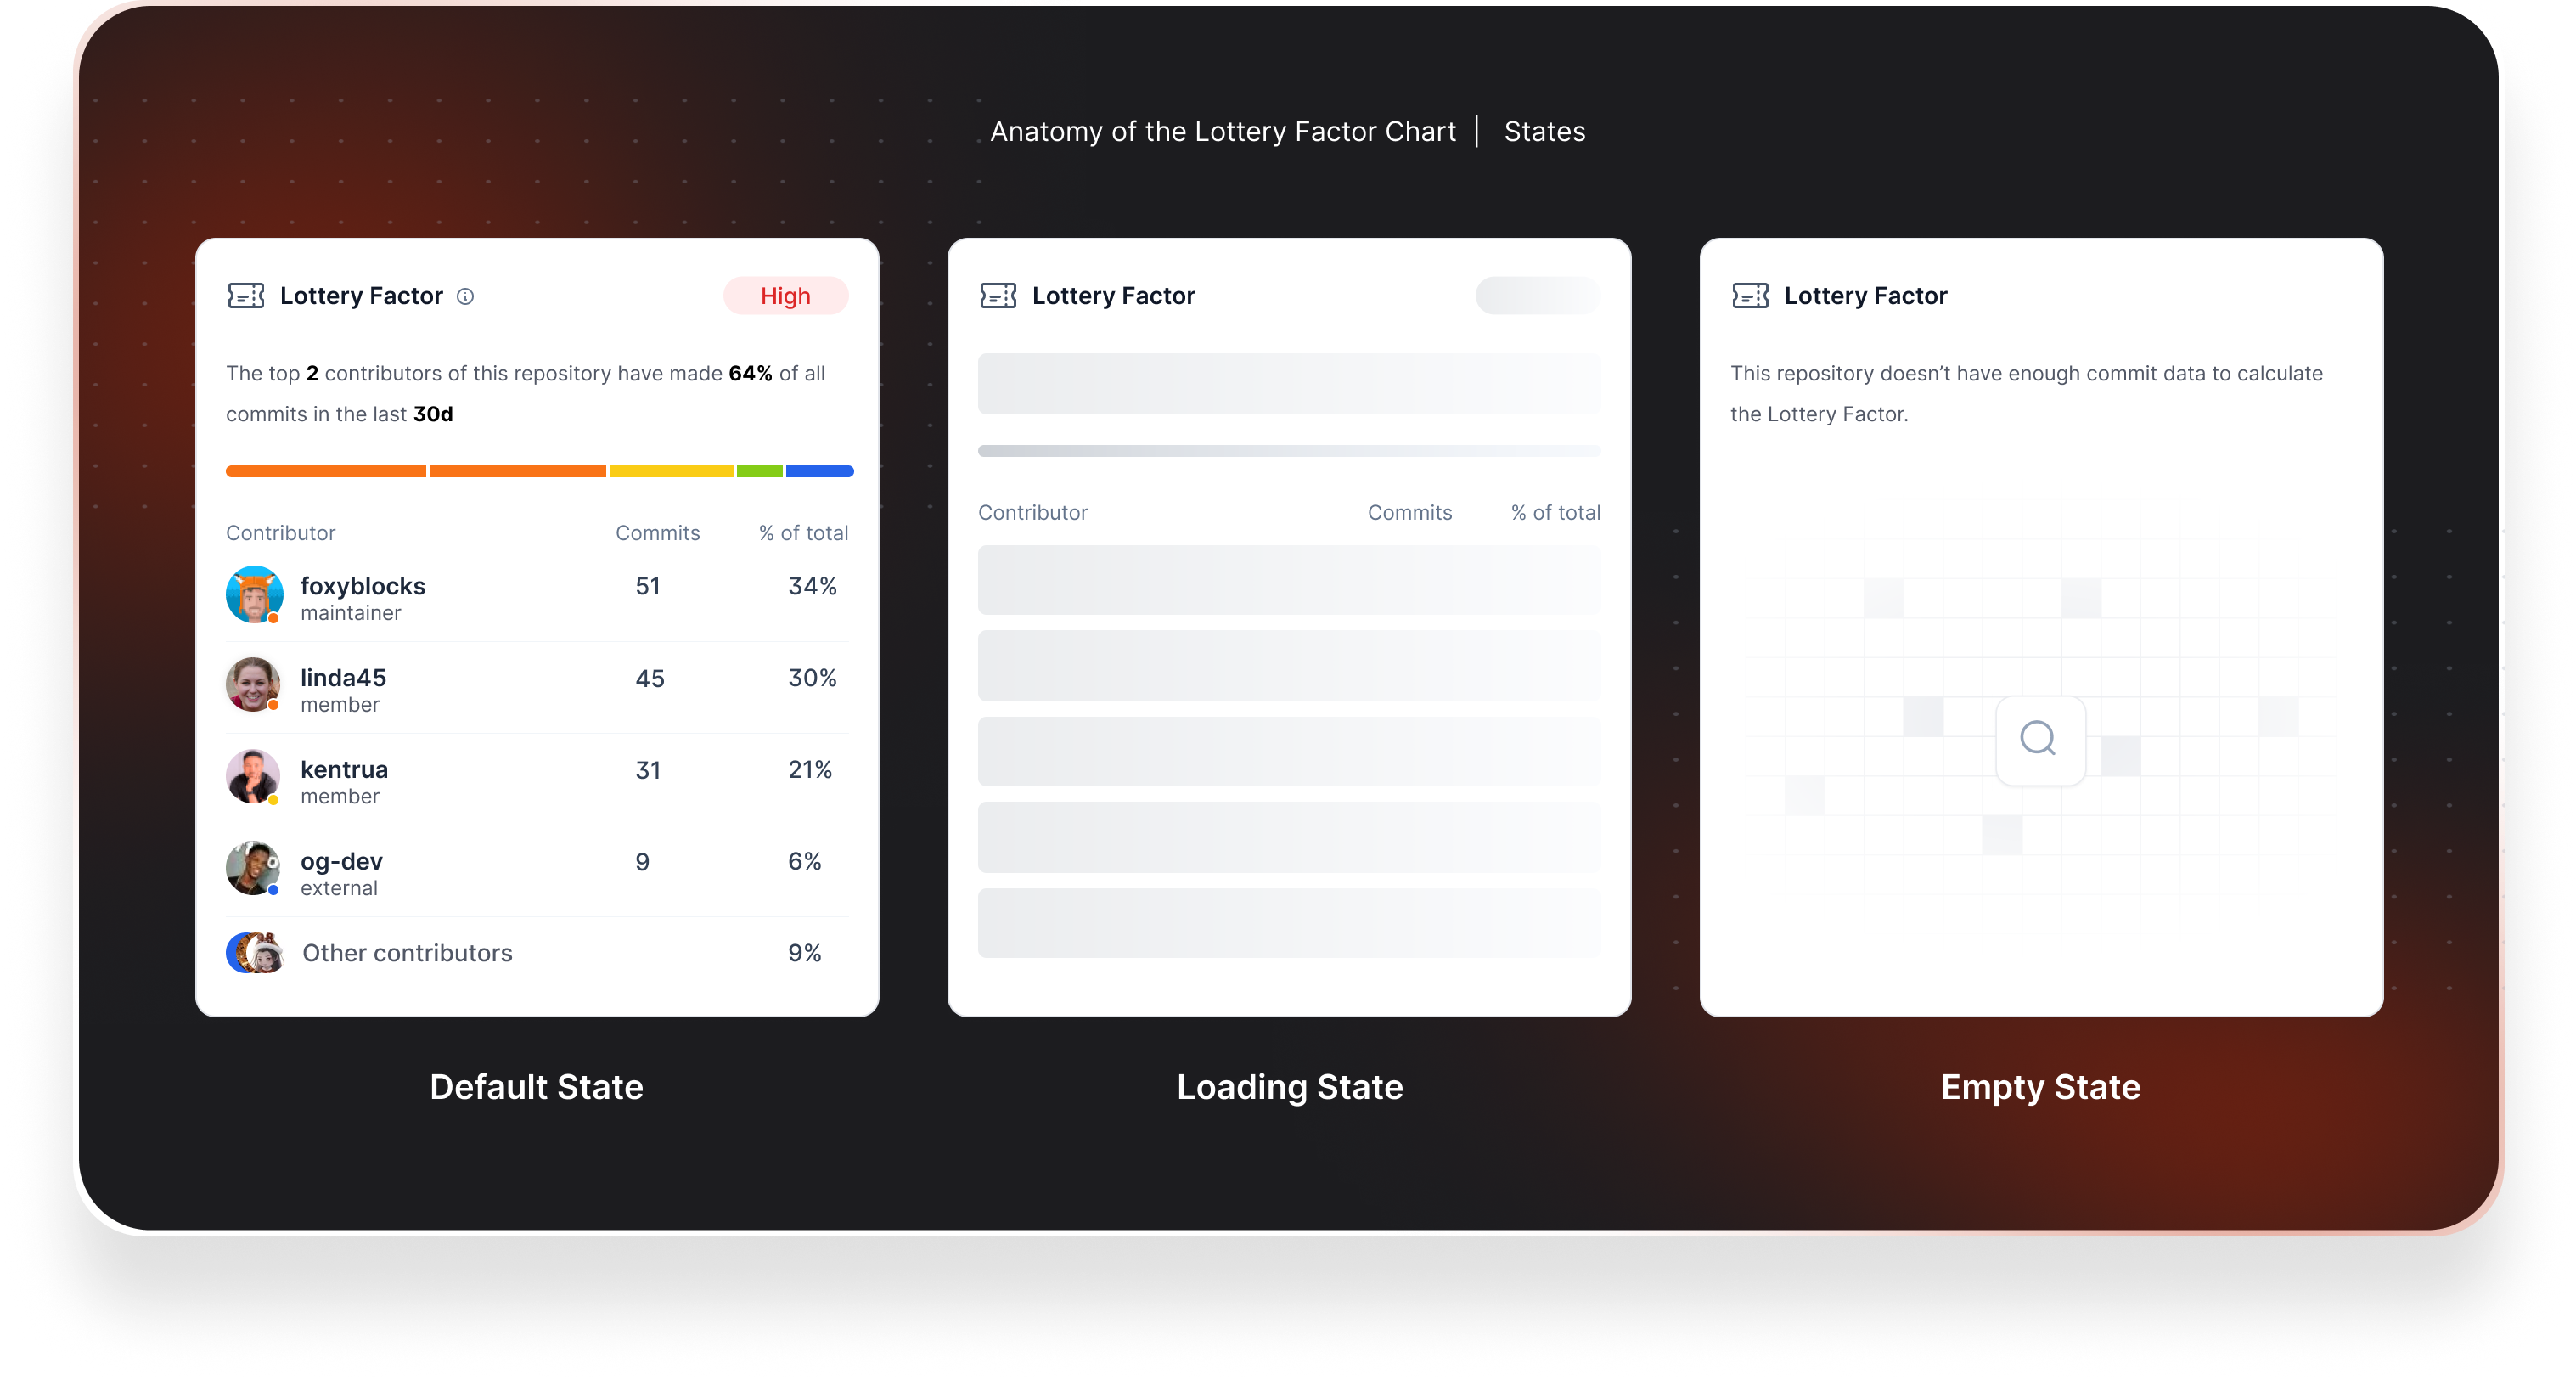
The result
The final design of the Lottery Factor chart included a mix of visual cues, data and written context to communicate the metric to users:
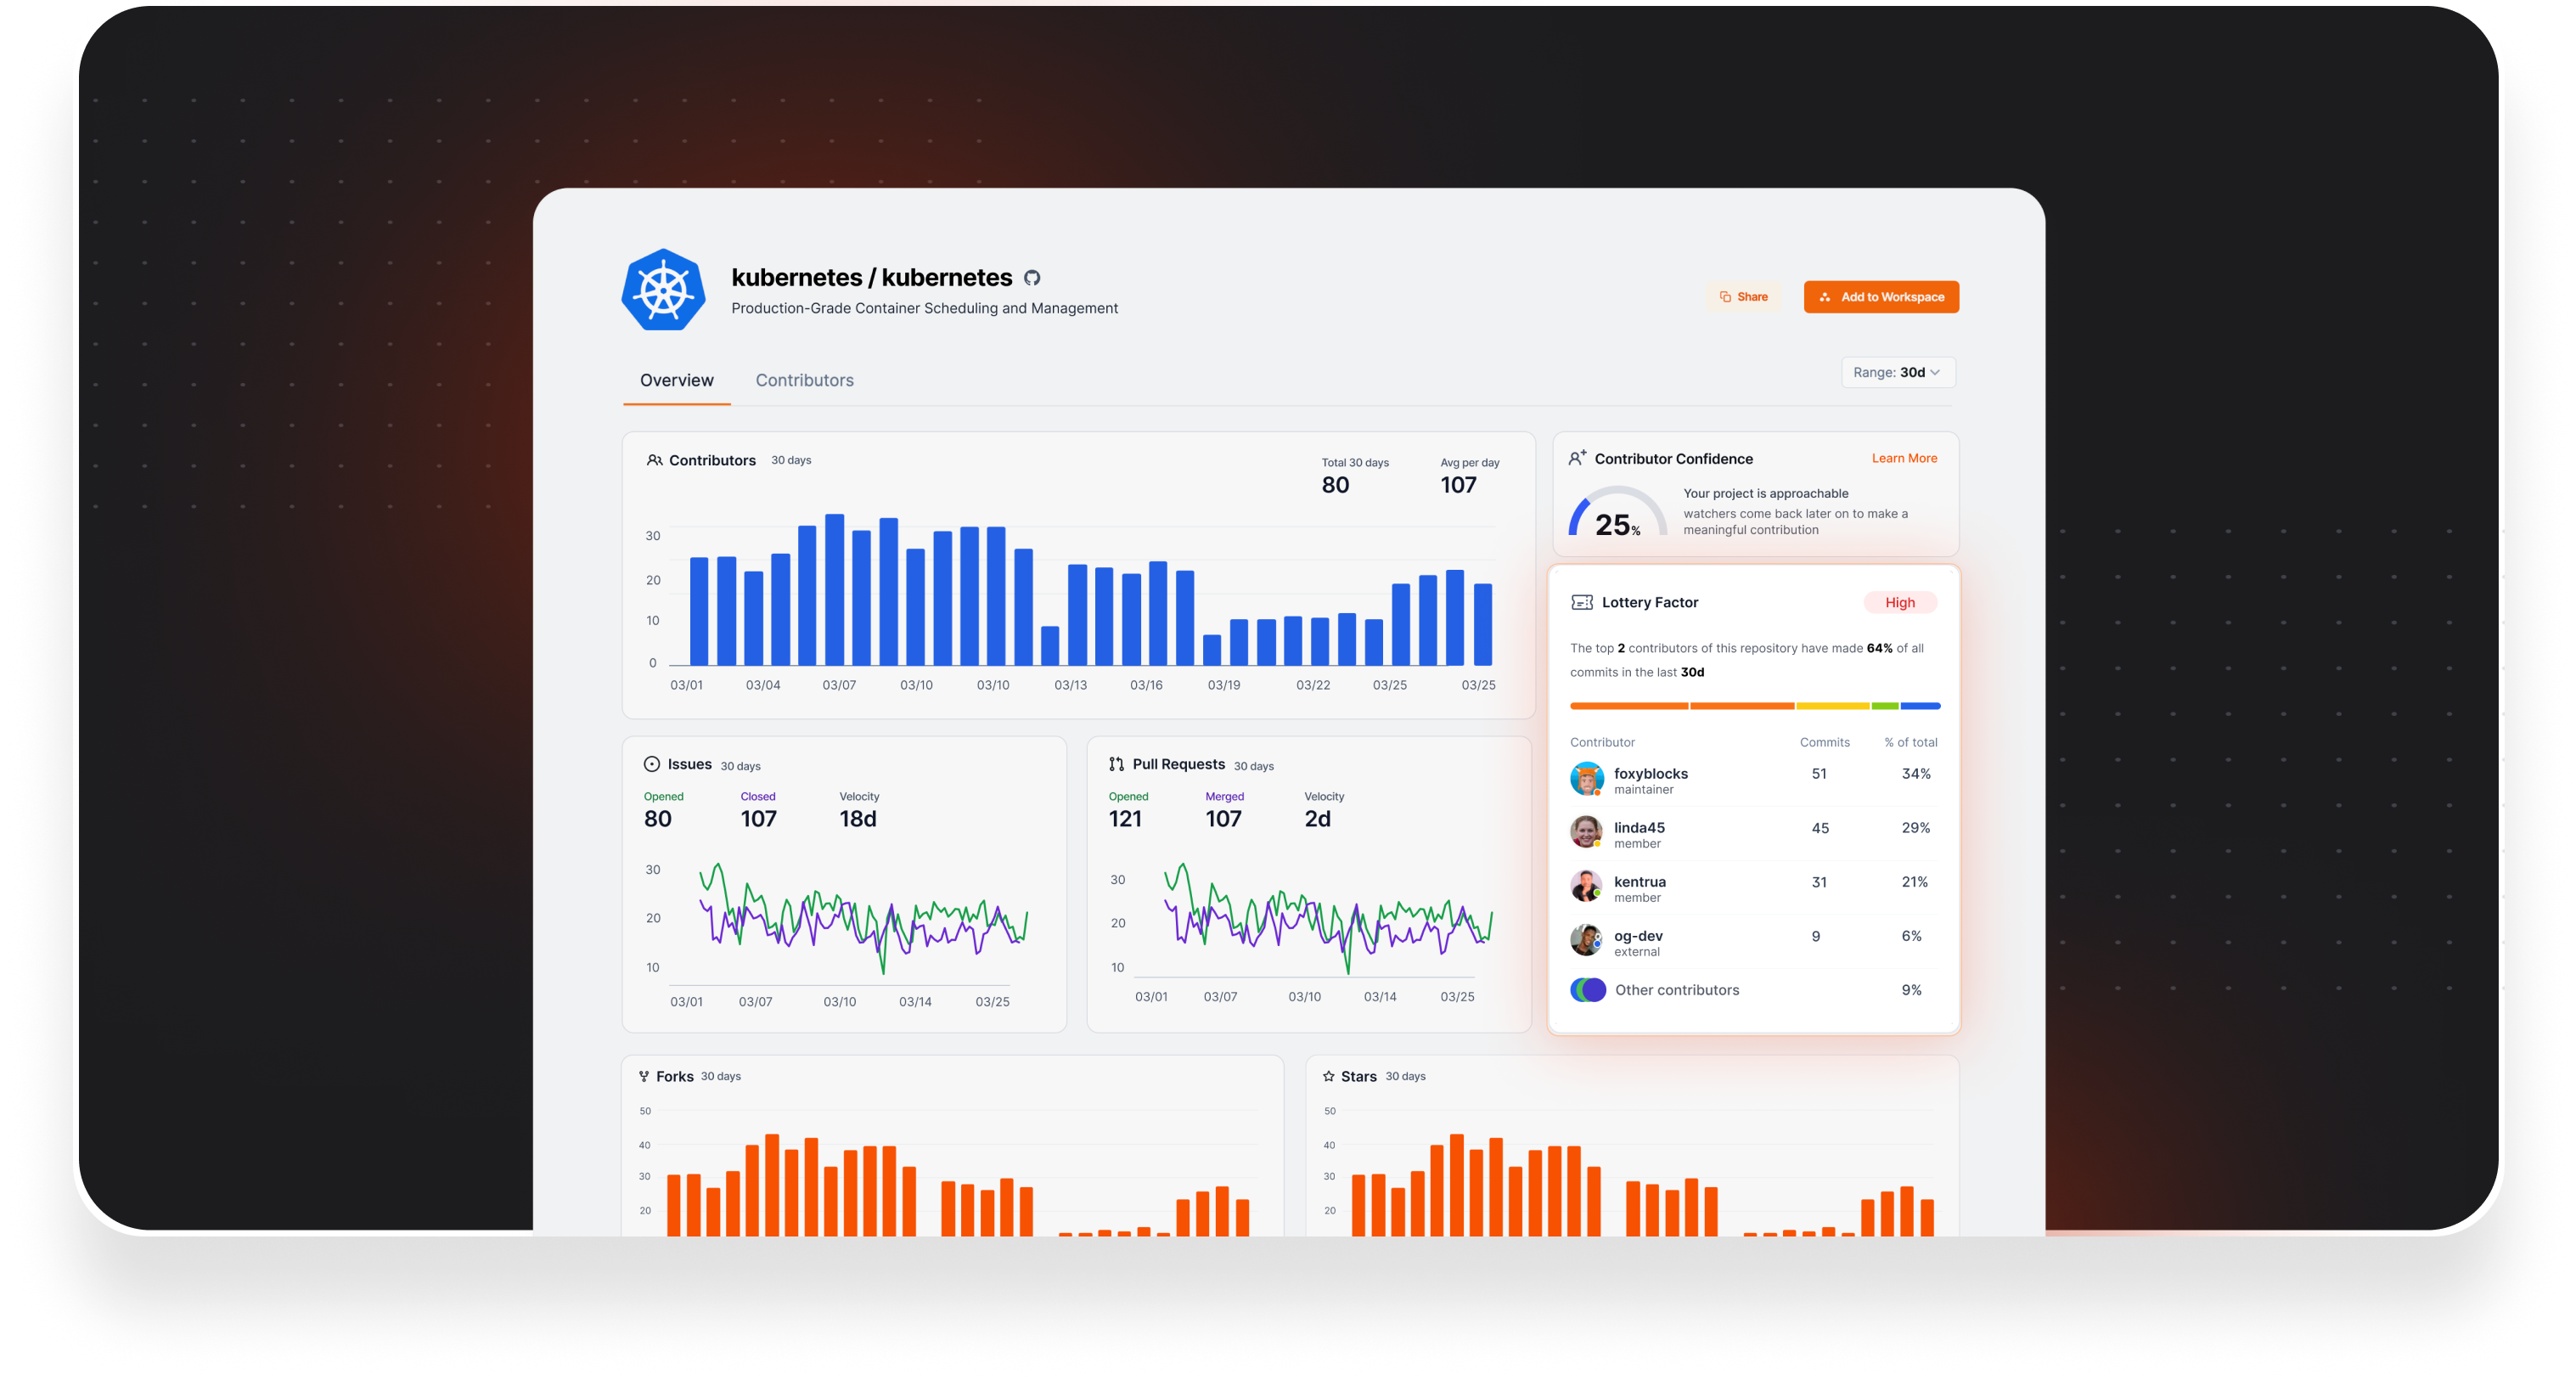
Lottery Factor 🤝 Repo Pages
In the context of Repo Pages, the Lottery Factor helps paint the full picture on any specific repository. As useful as it is by itself, the real value of this chart is brought out by the other data points and context in Repo Pages, such as meta tags, number of contributors, activity indicators (Issue and PR charts) and the Contributor Confidence metric.
As an example, a repository with a very low number of contributors, a recent creation date, and low number of issues, PRs and stars could signal that this is a small, personal repository. In this case a high lottery factor is expected and considered normal.
But a project with a high number of contributors and consistent levels of high activity could mean that this is indeed a large project with an extensive community and potentially a lot of usage and adoption. Within that context, a very high lottery factor could very easily pose a high risk, giving users another data point when deciding whether to contribute or incorporate that project as a dependency.

Isa Bensusan
Product Designer at OpenSauced, previously Product Design lead at Google. Isa has been building digital products for the last 8 years, whether it's coding, designing or driving product strategy.
Recent Posts

bdougie
2 mins read
OpenSauced joins Linux Foundation, making AI-powered open source analytics freely available while expanding beyond GitHub to serve the broader open so...

#kubernetes
John McBride
5 mins read
How the OpenSauced engineering team made a near-zero downtime migration to Microsoft Azure